|
|
|
|
HerbalEGram: Volume 11, Issue 11, November 2014
Sales of Tea & Herbal Tea Increase 5.9% in United States in 2013
2014 Tea Sales on Track to Set a Record
By Brian
Keatinga, Ash Lindstromb, Mary Ellen Lynchc,
and Mark Blumenthalb
a
Sage Group Networks, Seattle, Washington, USA
b
American Botanical Council, Austin, Texas, USA
c
SPINS, Schaumberg, Illinois, USA
|
|
Introduction
Tea consumption in the United States, as in much
of the world, is on the rise. Total retail sales (some exceptions noted herein)
of bagged, loose, and concentrated teas in the United States increased by 5.9%
in 2013 according to aggregated market statistics gathered by the market
research firm SPINS (Table 1). This includes all types of tea and herbal teas
in all packaging formats with the exception of ready-to-drink (RTD) tea sold
through mainstream multi-outlets, natural, and specialty/gourmet channels. Growth
continued into 2014 with sales from August 2013 through August 2014 in those
channels up 5% over the previous period in 2012-2013. This is a significant
indicator of a rapidly emerging interest in tea by US consumers.
|
Tea
Facts
- After water, tea (i.e., beverages from the tea
plant, Camellia sinensis, Theaceae)
is the second-most consumed beverage worldwide.1
- On any given day, more than an estimated 50%
of Americans drink tea (including
iced). On a regional basis, the South and Northeast have the greatest
concentration of tea drinkers.1
- Approximately 85% of tea consumed in America
is iced. From 2002 to 2012, the ready-to-drink tea sector grew more than 15-fold.1
- Instant tea is declining and loose tea is gaining in popularity, especially
in specialty tea and coffee outlets.
- In 2012, Americans consumed well over 79
billion servings of tea — more than 3.6 billion gallons. About 84% of all tea
consumed was black tea, 15% was green tea, with the remainder comprising
oolong and white tea.1
|
Assembling
a fully accurate statistical compilation of the US tea industry is a complex
undertaking due to a lack of harmonized definitions and the fact that no commercial
enterprise, trade association, or governmental agency tracks all of the diverse
distribution channels through which tea is sold. Very few reporting entities
monitor or analyze the US food-service industry specific to tea activity, despite
the fact that the Tea Association of America estimates 85% of US tea
consumption is iced tea, a majority of which is sold in food-service settings including
restaurants, cafés, delis, and similar establishments. Additionally, a number
of other tea distribution channels are not assessed by any one entity,
including mail order, online, network marketing, Whole Foods Market, and
thousands of independent specialty tea shops.
In 1990, sales of tea sold through all distribution channels in the United
States was less than $1 billion dollars annually, according to Sage Group. Estimates
of the total market size now range from $4 to 5 billion to upwards of $15
billion. The fact that tea is such a ubiquitous commodity sold in myriad
packaging formats through a wide variety of diverse channels makes consistent quantification
an imperfect science. Packaged Facts, a market research publisher based in
Rockville, Maryland, forecasts that sales of tea in the United States will
reach $25 billion in 2014. They predict $6.2 billion (or 25%) in sales from
retail stores of all formats and $18.8 billion from food-service distribution. Leaf
tea dollar sales grew by 6% in 2013 in the mass market, and sales of fresh
refrigerated teas grew by 4%, while instant tea dropped by 10%.2
Three primary factors are catalyzing the US demand for tea:
- Health & Wellness Trend: Consumers are seeking
affordable, safe ways to enhance their personal wellness and self-care
regimens.
- Media Coverage: Consistent media coverage delivering
a stream of positive research validating the benefits of tea consumption —
including potential prevention of certain diseases and/or enhanced states of
wellbeing — is helping educate and motivate consumers.
- Evolving Retail Landscape: Thousands of
independent and multi-unit tea retail outlets are expanding nationwide,
offering greater consumer access to finer-quality specialty teas.
In 2012, global specialty coffee leader
Starbucks acquired Teavana, the largest North American retail tea chain
formerly based in Atlanta, Georgia and now located within Starbucks
headquarters in Seattle, Washington. Starbucks paid $620 million to acquire Teavana,
which comprised more than 325 shops and a vibrant consumer-direct online business
as well. In 1999, Starbucks also purchased specialty tea maker Tazo, a producer
of both black and green tea blends and herbal teas. Chief Executive Officer Howard Schultz described tea as a “$90
billion global market opportunity” in a press release posted on the company’s
website in 2013.3 According
to an article, Schultz said to “expect 1,000 such (Teavana) tea bars in the
next five years as Teavana aims to do for tea what its parent company has done
for coffee.”4 Unilever, parent company of Lipton, the world’s
largest tea brand, also has entered the specialty retail tea business with its
2014 acquisition of T2, a multi-unit chain based in Australia. Additionally, Unilever
has touted its ongoing interest in expanding further into the global tea
sphere. George Jage, founder of the World Tea Expo, predicts there will be
nearly “8,000 tea-specific retail outlets in the US by 2018; moreover, an
estimated 40,000 traditional coffee retailers will generate more than 30% of
their beverage sales from tea.”5
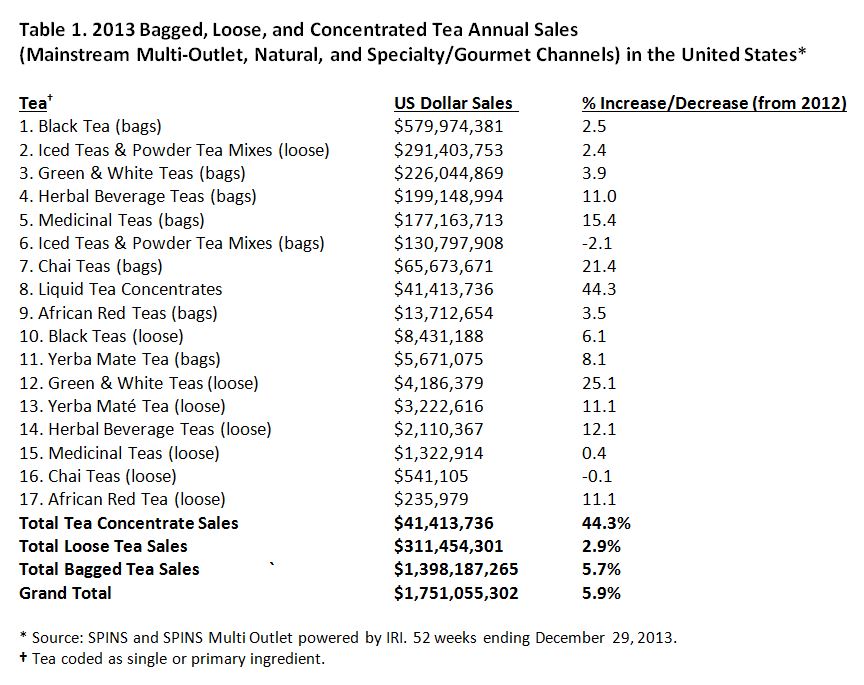
With
few exceptions, 2013 was another banner year for the majority of bagged and
loose tea categories within all distribution channels. Black tea (bags) held
its seemingly permanent number one spot in dollar sales even with very modest
gains (2.5%) over 2012. Iced teas remain in a solid second overall position due
to many factors including very warm summers (2012-2013) and consumer
populations reaching for alternatives to carbonated soda. Total sales volume for
carbonated soda drinks fell 3% in 2013 — the ninth consecutive year of decline
according to Beverage Digest6
— after declines of 1.2% in 2012 and 1% in 2011.
Iced tea, as measured by gallons consumed and total sales, is the single
largest type of tea consumed in the United States, according to the Tea
Association of America, yet most of this is consumed in food service
establishments, which are not tracked by major consumer product monitoring
agencies.
Green and white teas continue to hold a respectable third overall position in
terms of total dollar sales, with a nearly 4% gain (tea bags) in 2013 over
2012. It is important to note that total dollar sales of white tea in the
United States remain nominal, with very few brands offering white tea products
and modest annual production (estimated by Sage Group at less than 1% of global
annual tea production) in China’s Fujian province, where white tea originated
and remains the top-producing region. Between the mid 2000s and 2011, green tea
consumption in the United States increased at a far greater rate — high double
digits for many product formats — and has declined, in bagged formats, to more
sustainable growth rates. Green and white teas in loose forms significantly
outperformed their bagged counterparts in 2013 with more than 25% growth over
2012. This is in part due to the increasing willingness by consumers to brew
loose tea (which usually costs less than bagged tea) at home and also a result
of the dozens of tea brands more effectively educating consumers on the
superior flavors typically associated with loose teas vs. tea bags; such brands
essentially are encouraging their customers to trade the convenience of tea
bags for better “cup quality” (improved flavor, aroma, color, and mouth-feel).
The fact that total green tea sales in the United States are approaching half
that of black tea is impressive for a nation of tea drinkers who historically
have favored black tea. The growing body of scientific research increasingly
validating green tea’s health benefits is impressive, and announcements of
recent positive findings are picked up by global media with more frequency.
Herbal beverage teas and medicinal teas sold in tea bags stood strong in fourth
and fifth place, respectively, with both reaching impressive double-digit
year-over-year gains of 11% for bagged herbal beverage tea and 15.4% for bagged
medicinal teas. While loose forms of both exhibited increased sales for 2013
over 2012, their combined revenue was modest. When it comes to consumption of
herbal beverage teas and medicinal teas, Americans still prefer the ease of a
tea bag over loose tea, while many also consume herbal dietary supplements as
analyzed in HerbalGram’s annual Herb
Market Report.7 The rise in sales for herbal beverage and medicinal
teas during 2013 can be attributed to many factors and is indicative of a
growing interest in using readily obtainable botanicals to enhance personal
wellness and self-care regimens. The 7.9% growth in herbal dietary supplement
sales in 2013 vs. 2012, as calculated by SPINS/IRI and reported in HerbalGram, adds further validation to
this perspective.
African rooibos (“red tea”; Aspalathus
linearis, Fabaceae) also showed double-digit annual sales gains in loose
form while rooibos in tea bags experienced steady increase. Rooibos has enjoyed
consistent growth for more than a decade due its lack of caffeine, its
naturally occurring antioxidants, and as a result of aggressive promotion by
South African producers. While herbal beverage and medicinal teas are commonplace
in Europe and Asia, Table 1 illustrates that Americans are starting to embrace
them more proactively. The fallout over undesirable effects of caffeine in
energy drinks, greater awareness of caffeine-insomnia connections, and coffee
“burn-out” may also be contributing to the rise in sales of rooibos and herbal
beverage teas as healthy, caffeine-free alternatives. The 15.4% rise in
medicinal tea bag sales for 2013 also indicates significant and increasing
consumer interest in supporting wellness-oriented lifestyle choices.
|
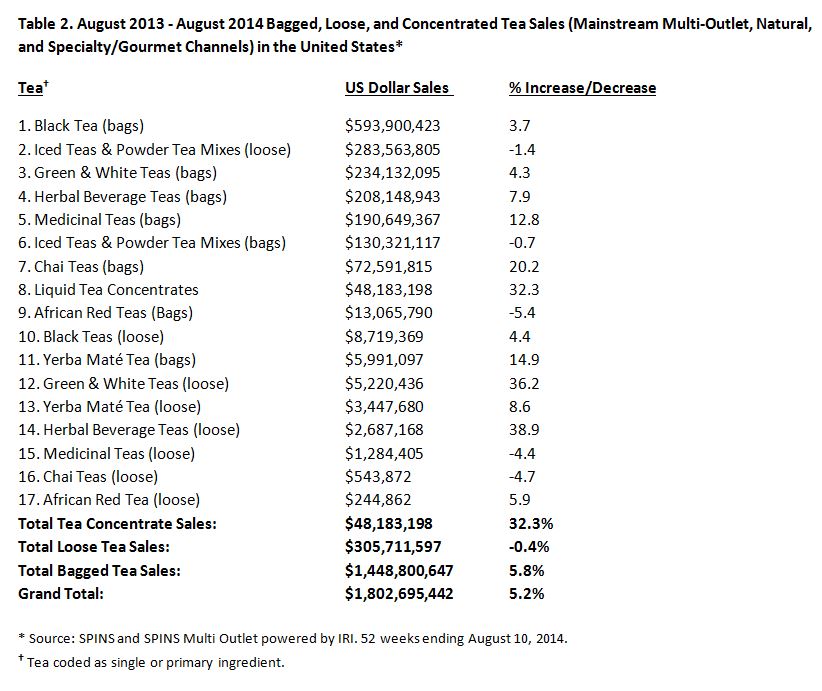
As
shown in Table 2, sales of all bagged, loose, and concentrated teas sold
through all channels in the United States through August 2014 remain steady.
Iced tea sales declined slightly, perhaps due to consumers’ reaching more often
in 2014 for ready-to-drink iced teas and for other non-tea beverage selections.
It is worth noting that, for this most recently measured 52-week period for
2013/2014, annual sales had already topped $1.8 billion. Sales for all of 2013
were $1.75 billion. Should this upward trend continue or even accelerate, it is
conceivable that 2014 tea sales – in all formats and channels – will exceed
2013 levels. Medicinal teas (tea bags), chai (tea bags), liquid concentrates
(chai, iced tea, etc.), yerba maté (Ilex paraguariensis,
Aquifoliaceae; tea bags), green and
white teas (loose), and herbal beverage (loose) teas all are scoring impressive
double-digit gains. 2014 promises to be a very strong year for the US tea
industry with record sales and energized growth momentum.
Chai
tea is a traditional Indian tea-based beverage made with black tea and various
spices such as ginger (Zingiber
officinale, Zingiberaceae), cardamom (Elettaria
cardamomum, Zingiberaceae), and cinnamon (Cinnamomum spp., Lauraceae), among others. Chai tea bags are showing considerable advances
with a 20.2% increase, likely due to a greater number of brands adding chai to
their tea bag lines. In this same realm, sales of liquid tea concentrates are
exhibiting a very strong increase — 32.3% — over the previous year. These
liquid teas most often are concentrated chai, tea and lemonade combinations,
and other flavorful blends that allow consumers to prepare them easily, without
any brewing, and in iced or hot drinks. Some of the smaller chai companies that
started in the 1990s are maturing into sizeable ventures, and this is one
reason the category is heating up: most manufacture liquid concentrates, not
tea bags. A number of companies also are promoting liquid tea concentrates as a
more economical way to enjoy tea based on the fact that they provide consumers
a lower per-serving cost than most ready-to-drink teas.
  The Ready-to-Drink Tea Market
Ready-to-drink
bottled teas have improved in quality over the last few years, which may be one
reason why the category has expanded so impressively in the United States.
Additionally, greater numbers of low-/no-sugar and organic RTD tea products
have widened consumer choices further within the category. A decline in
carbonated soda drink (CSD) consumption in the US also is driving the RTD tea
segment. Although CSDs are the most widely consumed beverage in the US, CSDs reported
a year-to-year drop in volume during 2013 – down 1.42% in convenience store outlets
(one of the strongest distribution channels for RTD tea) compared to 2012.8
Market research firm Canadean notes in its Global Iced/RTD Tea Drinks Report that
the $5.1 billion US market for RTD tea is expected to increase to $5.3 billion
in 2014, with a projected growth rate of 6% through 2018.9 “The
refreshing taste and perceived natural, healthy image of iced/RTD tea drinks
will continue to generate growth and place the category in a good position to
take advantage of the slowing carbonates market,” according to Canadean.8
CSD giant Coca-Cola continues to support its growing RTD tea beverage portfolio,
which includes the Gold Peak®, Honest Tea®, and Fuze® tea brands. Certified
organic RTD tea brand Honest Tea marked its one billionth beverage sale during
June 2014, with 888 million unit sales since Coca-Cola acquired the brand in
2008.10 In
spite of the positive performance of RTD tea brands owned by the CSD
conglomerates such as Pepsi and Coca-Cola, CSD sales in the US have declined
nine years in a row through 2013.6
While 2013 sales of RTD tea were flat or growing in the low single-digit levels
in many distribution channels, the bottled tea category still holds plenty of
promise when population growth and inflation are taken into consideration. “RTD
canned and bottled tea sales are essentially flat and present a number of challenges,”
said David Sprinkle at Packaged Facts (personal communication, October 31,
2014). “There are plenty of opportunities to continue to ratchet up category
innovation by supporting the trend toward premiumization, incorporating unique
ingredients, and pursuing innovations in packaging formats.”
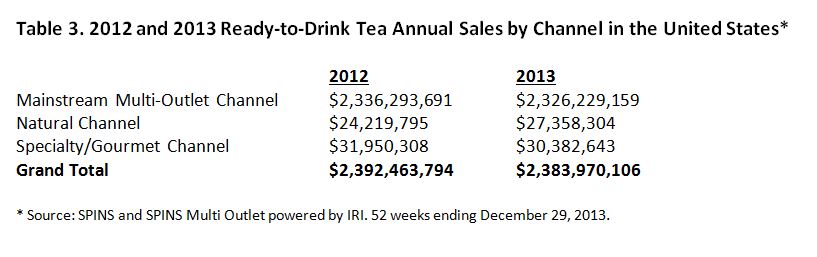
After years of explosive US growth for RTD tea sales — taking the category to
over $5 billion in annual revenue — the flattening out of 2013 sales vs. 2012,
as reflected in Tables 3-5, is viewed as a temporary situation according to tea
industry experts. The slowdown is likely attributable to a cooler summer
nationwide (in the US) in 2013 vs. 2012, as RTD beverages sell better in hotter
weather, as well as other factors including greater numbers of people brewing
their own tea (bagged and loose).
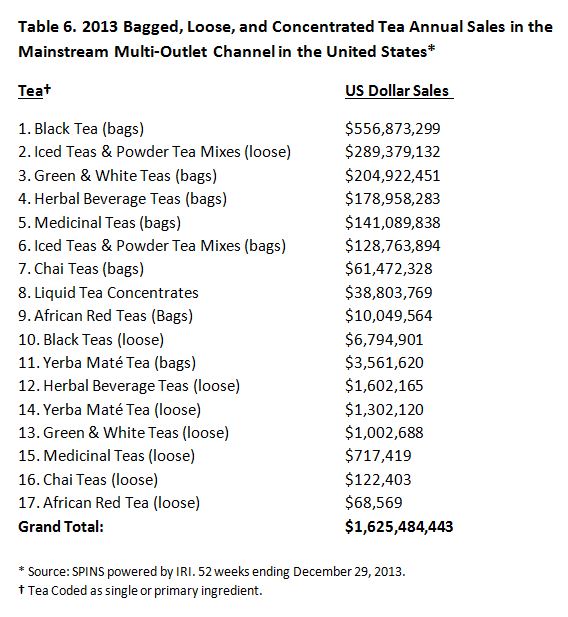
Mainstream,
multi-unit outlets — a channel comprising the food, drug, and mass market
sector (or “FDM”; supermarkets, drugstores, and mass market retailers),
military commissaries, select buyer’s clubs, and
so-called dollar stores, but not convenience stores or coffee/tea retailers
such as Starbucks — typically stock more conventional tea brands than specialty
types, with fewer organic, long-leaf loose, and other types of tea more common
to natural food and specialty gourmet outlets. Shoppers at mainstream outlets
are purchasing greater varieties of tea types than ever before, but many still
visit other retailers to purchase specialty teas. With tea bags and loose tea
products as seven out of the top ten items ranked on sales (Table 6), it is
clear the mainstream market consumers are seeking convenience.
The Natural Channel and Medicinal Teas
While
liquid tea concentrates in the form of ever-popular chai and various iced black
and green teas are making headway in natural channel stores, green and white,
herbal beverage, and medicinal teas are among the five top-selling tea types.
An aging “baby boomer” (Americans born between 1946 and 1964) population
seeking less caffeine (characteristic of herbal and medicinal teas) and more
support for their individual wellness programs is likely a catalyst to these
top sales rankings for the aforementioned teas. A steady flow of media coverage
spotlighting the positive outcomes of clinical trials on various teas —
especially green — and herbs used in medicinal tea formulations also is
contributing to elevated sales, up from lower sales statuses in the mainstream
mass-market outlets prior to the mid-2000s.

The six
top-selling medicinal tea brands for 2013 include Traditional Medicinals, Yogi
Tea, Celestial Seasonings, Stash, Triple Leaf, and Organic India.
Green
and white teas held a coveted second place position in the natural channel for
2013, outselling even black teas, which perpetually dominate green tea sales in
mainstream channels. Natural channel consumers are generally aware of the
health-promoting benefits afforded by green tea consumption, and many of the
premium-grade green teas are available in natural channel outlets. Fittingly,
in 2013, herbal beverage teas landed a comfortable third-place position in the
natural channel, in which chai and African rooibos (“red tea”) also sell exceptionally well.
The
cult-like fan-base for South American yerba maté purchases much of this
botanical beverage from natural channel retailers, helping to place both bagged
and loose forms among 2013’s top-ten sellers.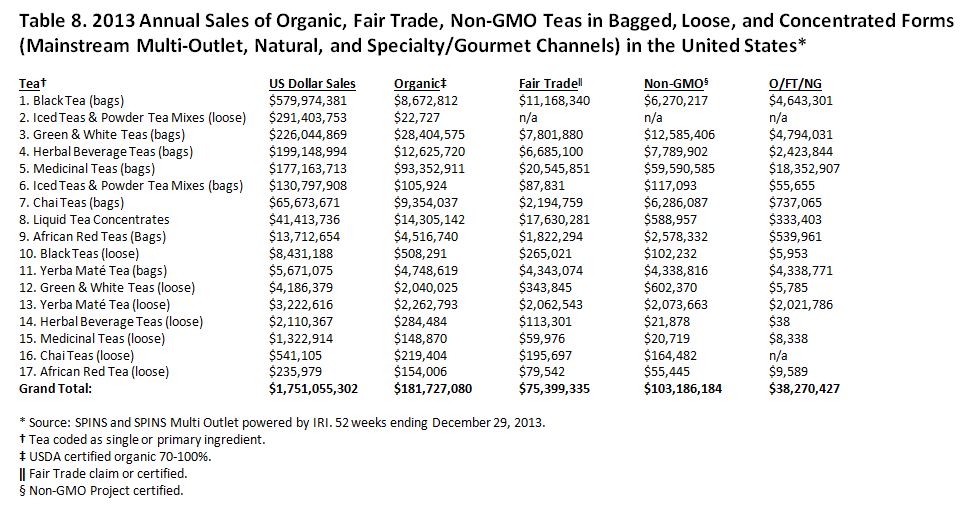 In
the early 2000s, certified organic teas began to make solid inroads with
American consumers, while certified Fair Trade tea was largely still in the
germinal stage of project development with certifying agencies. Concerns over
genetically modified products (referred to most commonly as GMOs, genetically
modified organisms), including tea (and even tea-bag materials), simply were
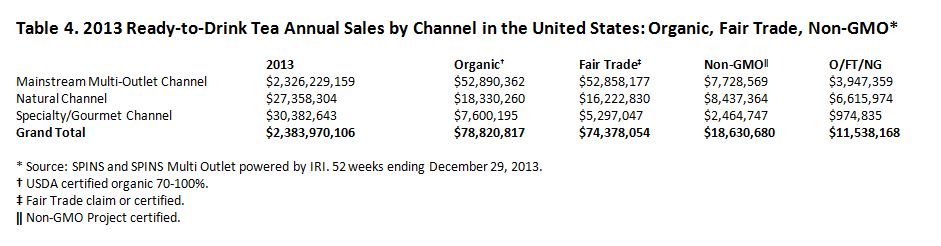
not in the public consciousness. Table 8 demonstrates that, in 2013, these
three areas of interest and concern specific to tea have obtained significant
market prominence, albeit still a small portion of total tea sales. Certified
organic iced teas (and powdered mixes — considered a very small portion of the
total for the two formats) and bagged medicinal teas led in ranking of organic
teas with more than $105.9 million and $93.3 million in sales, respectively.
Medicinal tea brands routinely seek out the purest possible botanicals — herbs,
teas, and spices — which commonly equates to the utilization of certified
organic ingredients free from pesticides and other chemical contaminants. Even
with herbal beverage and black teas showing strong sales in the organic
classification, SPINS-estimated sales for all organic bagged, loose, and liquid
tea concentrates were $181.7 million for 2013, just over 10% of total US tea
sales that year.
Total sales of certified Fair Trade teas as calculated by SPINS for 2013 were
$75.4 million, with medicinal teas (bags) once again in the number-one spot at
$20.5 million, with green and white teas (bags) a distant second, bringing in
$7.8 million.
Non-GMO (genetically modified organism) teas pulled in sales of $103.1 million
during 2013, according to SPINS. It is important to note that the authors were
not able to locate any tea agency, association, or producer that is currently
aware of teas (C. sinensis) being
grown utilizing GMO technology. With consumer awareness and concerns about GMOs,
some tea brands are nonetheless communicating that they are indeed “GMO-Free”
to perhaps allay potential fears or questions.
It is worth noting that some plant ingredients used in medicinal and herbal
beverage teas can be obtained from GMO-sources, such as cornsilk (Zea mays,
Poaceae) style and stigma,11 eucalyptus (Eucalyptus globulus,
Myrtaceae)12 and papaya (Carica papaya, Caricaceae) leaves.11
In teas formulated with excipients, colorants, extracts, flavors, and/or
nutrients, GMO elements may be incorporated as well (J. Brinckmann, email to A.
Lindstrom, November 6, 2014). Extracts and flavors sometimes utilize corn- and
soy-based components that are not legally required to be declared on labeling;
dry “natural flavors,” for example, frequently are produced by combining corn-
and/or soy-based excipients with essential oils. According to the Non-GMO
Project, 88% of the American corn crop is genetically modified and 94% of the
soy crop.13 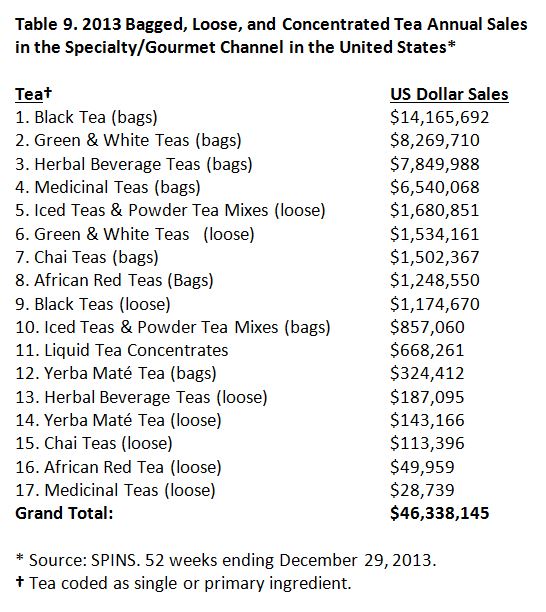
The
specialty/gourmet channel (i.e., full-format
supermarkets with more than $2 million in annual sales and with specialty items
comprising at least 25% of overall volume, as well as high-end, experiential
stores featuring full-service gourmet departments and high-quality products
with a strong focus on specialty, imported, natural, and organic items),
like the natural foods channel, consistently has supported specialty tea
business development, and it is a prime “venue” for new tea brands to garner
sales experience before making the jump to mainstream market shelves. In this
channel, bagged teas (vs. loose or liquids forms) lead the pack — as they do in
all channels — with their ease-of-preparation convenience. Black tea sales
totaling $14.1 million for 2013 in this channel showcase its immense popularity
with specialty/gourmet consumers as indicated by a nearly two-to-one lead in
sales over the next closest category, green and white teas (bags), at $8.2
million in sales.
While
specialty/gourmet consumers frequent these outlets seeking out exotic foods,
flavors, and ingredients, it should be mentioned that even in this channel,
interest in and purchases of medicinal tea is high. Total sales of $6.5 million
in 2013 indicate this is a small percentage of annual medicinal tea sales in
the US; nonetheless, that medicinal tea bags hold the fourth position of 17
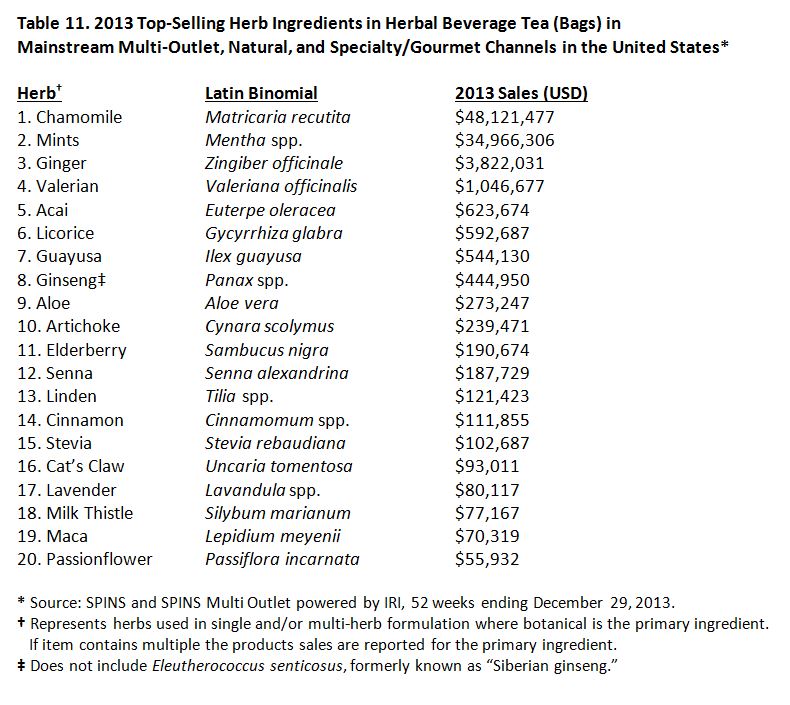
monitored teas and formats illuminates the growing interest in medicinal teas. 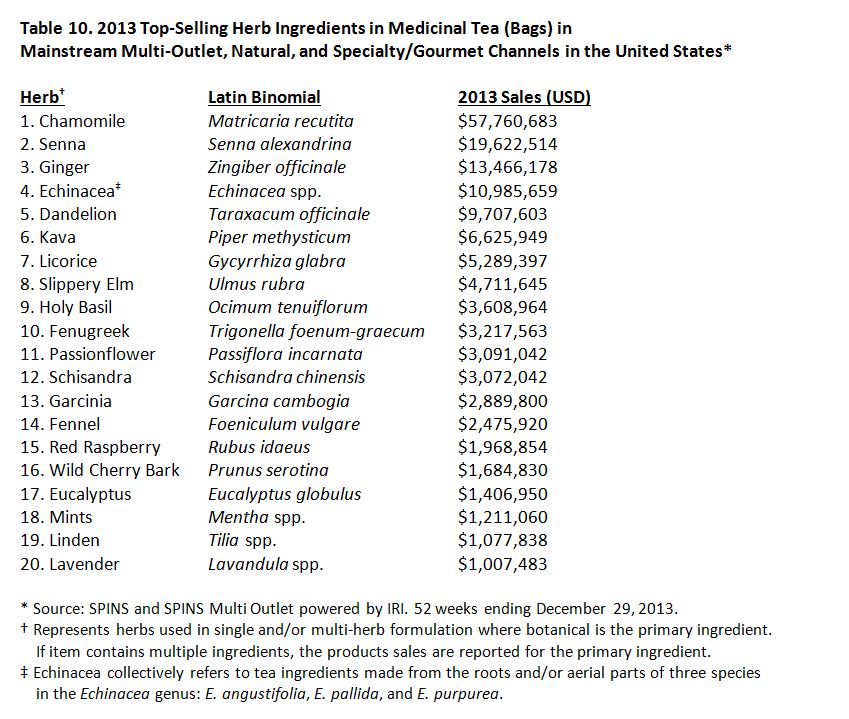 As in
the herbal dietary supplements sector, 2013’s top-selling herb ingredients in
medicinal tea bags comprise those with structure-function claims such as immune
and/or digestive support, stress regulation, and weight-loss promotion.
Chamomile, kava, and lavender are known for their anxiolytic effects, and
passionflower has been administered to treat insomnia. Schisandra is a
so-called “adaptogenic” herb with claimed stress-protective properties.
Senna is reliably popular as a natural laxative, and therefore utilized in
products meant to treat constipation or promote weight loss. Ginger and various
mints are used in digestive-support formulations, and fennel to treat
flatulence. The presence of Garcinia
cambogia illustrates the ongoing power of “The Dr. Oz Effect”; the
cardiologist and talk-show host recently came under fire at a Senate hearing
for his promotion of this purported weight-loss aid (among others) due to the
alleged lack of scientific support.
Echinacea tea is part of many Americans’ cold and flu prevention and/or
treatment regimens; licorice and slippery elm — due to their mucilaginous
properties — are present in many formulations intended to soothe symptoms such
as sore throat and cough, as is wild cherry bark. Eucalyptus, a major
ingredient in many cough drops, often is utilized to relieve sinus and
respiratory symptoms associated with colds and flu. Red raspberry leaf is a
component of many pregnancy-support tea formulations.
Tea Packaging
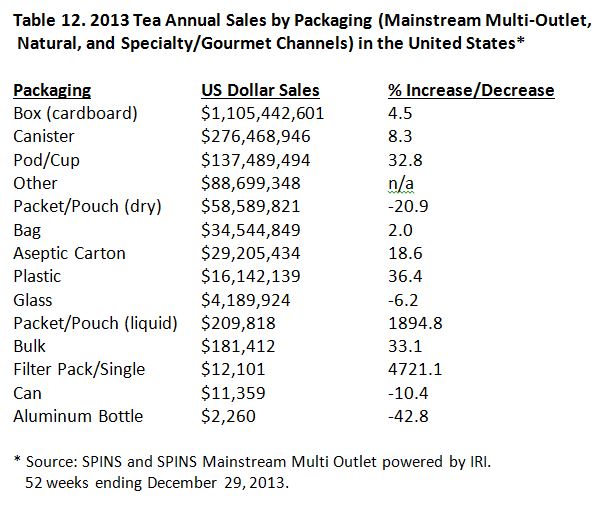 Folding
carton “boxes” manufactured using boxboard remains the primary unit packaging
for tea products for dry (bagged and loose) teas. Production of cartons is
cost-effective for tea brands and, increasingly, such cartons are made from
recycled or recyclable materials (and commonly printed with soy-based inks).
While some smaller and mid-size tea brands utilize round canisters to
merchandise their teas, this type of packaging has its limitations — they are
not always recyclable, they make less-efficient use of precious shelf space on already-crowded
retail shelves, and they are considerably more expensive than cartons. While canisters
showed an 8.3% growth gain for 2013 — higher than what boxes delivered that
same year (4.5%) — it is probable this rise is largely attributable to a couple
of mid-size tea brands experiencing solid growth that are still using canisters
vs. boxes. Many newer tea brands package their products in canisters in their
early years and then convert their packaging to boxes later on, when the
realities of lower unit costs are realized and the savings can be passed on to
increasingly discerning consumers. During late 2013 and early 2014, a number of
small-to-mid-size tea brands transitioned from canisters to boxes.
The “pod/cup” phenomenon originated with small, pre-measured portions of ground
coffee packaged in a capsule-type unit that is then placed into an automatic
electric appliance. Pressurized hot water then runs through the pod, making a
cup of coffee. Pod machines formerly were utilized frequently in hotels and
offices, but more recently, they have transitioned into home kitchens as well.
A common trade and consumer complaint with this advanced brewing technology is
the fact that a majority of pods are not fully recyclable, although some pod
brands are getting close to that objective. During 2012 and 2013, tea pod products containing higher-quality specialty teas
were launched by a few well-known specialty tea brands, as well as a large
coffee and tea private label manufacturer that now offers tea pods in addition
to traditional tea bags. The fast-and-easy preparation is ushering in a new era
in tea preparation. Like the coffee pods before them, tea pods have a bright
future within hospitality, workplace, and some food-service establishments. In
spite of these developments, the unit cost of producing a pod — comprising both
materials and manufacturing — leads many pod producers to utilize lower-grade
teas; long-leaf teas that produce the superior cups of tea cannot be used in
the pods’ constrained, small space. The short steeping time — due to the
pressured hot water — for teas also produces a moderate cup quality.
Regardless, pods are making a commercial splash and do offer a productive
tea-brewing solution in busy environments. With multiple tea-pod manufacturers
now in place, and a few specialty tea brands beginning to offer their own
branded tea pods, this market segment shows many signs of potential explosive
growth.
Conclusion
More impressive than the current size of the tea industry is the fact that, for
more than a decade, annual sales totals (cumulative totals for all packaging
formats and distribution channels) have grown consistently in the United States
with very few types of tea showing anything other than consistent gains. The
onslaught of hundreds of new retail tea outlets — and thousands more projected
to open in the next few years — parallels the germinal stages of the fledgling
US natural foods industry circa 1980-2000. Independent tea shops, as occurred
with “mom-and-pop” natural foods outlets, are morphing into multi-unit chains,
and increasing merger and acquisition activity of even smaller tea brands is
underway.
Interviews with tea industry experts categorically point to a robust and
thriving marketplace for tea and herbal tea for many years to come. Consumers
seeking to enhance individual self-care programs coupled with the
overwhelmingly positive media coverage of the health benefits of tea are
further catalyzing the marketplace.
As it has done for eons, tea is satisfying the needs of consumer populations
seeking economical, healthier ways to quench thirst, support health, and
nurture well-being.
References
- Tea
fact sheet. Tea
Association of the USA, Inc. website. Available at:
www.teausa.com/14655/tea-fact-sheet. Accessed November 3, 2014.
- Tea
and Ready-to-Drink Tea in the U.S.: Retail and Foodservice, 5th ed. Packaged
Facts website. Available at: www.packagedfacts.com/Tea-Ready-Drink-8090955/.
Accessed November 3, 2014.
- Teavana
fine teas + tea bar debuts in New York City’s Upper East Side. Starbucks
website. Available at: http://news.starbucks.com/news/teavana-fine-teas-tea-bar-debuts-in-new-york-citys-upper-east-side.
Accessed November 3, 2014.
- O’Connor
C. Starbucks opens its first tea bar as CEO Schultz bets on $90 billion market.
October 23, 2013. Forbes. Available
at:
www.forbes.com/sites/clareoconnor/2013/10/23/starbucks-opens-its-first-tea-bar-as-ceo-schultz-bets-on-90-billion-market/.
Accessed November 3, 2014.
- Jage
G. The greatest tea retail expansion has begun. World Tea News website.
Available at: www.worldteanews.com/insights/greatest-tea-retail-expansion-era-begun.
Accessed November 6, 2014.
- Special
issue: US beverage results for 2013. Beverage
Digest. Available at: www.beverage-digest.com/pdf/top-10_2014.pdf.
Accessed November 3, 2014.
- Lindstrom
A, Ooyen C, Lynch ME, Blumenthal M, Kawa K. Sales of herbal dietary supplements
increase by 7.9% in 2013, marking a decade of rising sales. HerbalGram. 2014;103:52-56.
- RTD
tea: the ultimate victor. World Tea News website. Available at: www.worldteanews.com/news/rtd-tea-ultimate-victor.
Accessed November 3, 2014.
- Global
Iced/RTD Tea Drinks Report. PR Newswire. Available at: www.prnewswire.com/news-releases/global-icedrtd-tea-drinks-report-2013-234062051.html.
Accessed November 3, 2014.
- Coca-cola
earnings review: volatile emerging economies limit top line growth. Trefis
website. Available at: www.trefis.com/articles/category/by-company/ko.
Accessed November 3, 2014.
- What is GMO? Agricultural crops that have a risk of being GMO. Non-GMO Project
website. Available at: www.nongmoproject.org/learn-more/what-is-gmo/. Accessed
November 6, 2014.
- Eucalyptus.
GMO Compass website. Available at: www.gmo-compass.org/eng/database/plants/34.eucalyptus.html.
Accessed November 6, 2014.
- Nature
vs. ‘Nurture’: The Splicing and Dicing of Our Food Supply. SPINS Trendwatch.
Schaumberg, Illinois: SPINSscan Natural. 2014: 1-2.
|
|
|
|
|
|