Issue:
105
Page: 59-67
Sales of Tea & Herbal Tea Increase 3.6% in United States in 2014
by Brian Keating, Ashley Lindstrom, Mary Ellen Lynch, Mark Blumenthal
HerbalGram.
2015; American Botanical Council
By Brian
Keatinga, Ash Lindstromb, Mary Ellen Lynchc,
and Mark Blumenthalb
aSage Group, Seattle, Washington, USA
bAmerican Botanical Council, Austin, Texas, USA
cSPINS, Schaumburg, Illinois, USA
Introduction
Tea
consumption in the United States, as in much of the world, is on the rise.
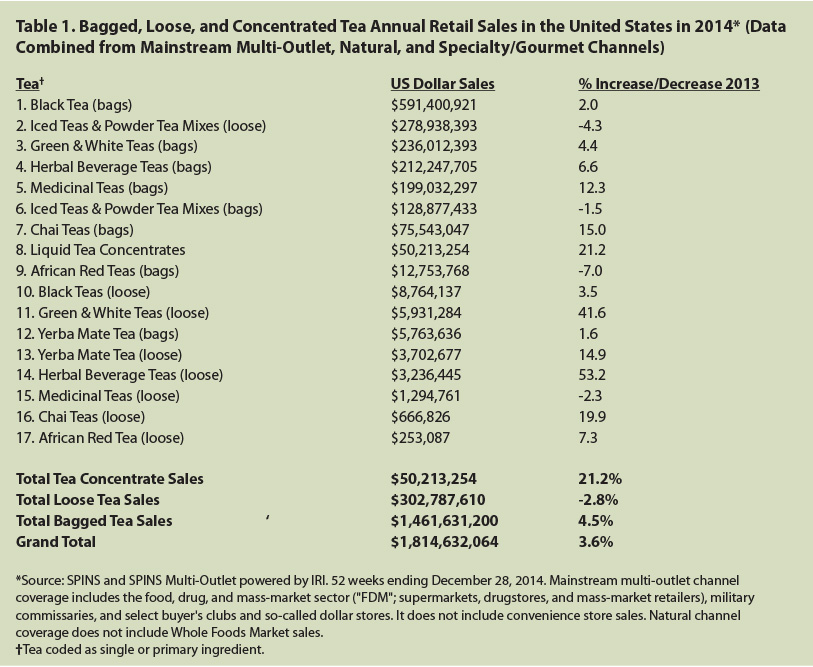
Total retail sales (some exceptions noted herein) of bagged, loose, and
concentrated teas in the United States increased by 3.6% in 2014, according to
aggregated market statistics gathered by the market research firm SPINS (Table
1). This includes all types of tea and herbal teas in all packaging formats
with the exception of ready-to-drink (RTD) tea sold through mainstream multi-outlets,
natural, and specialty/gourmet channels.
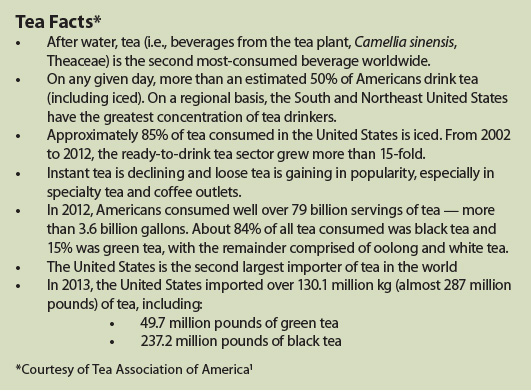 
Assembling a fully accurate statistical compilation of the US tea industry is a complex undertaking due to a lack of harmonized definitions and the fact that no commercial enterprise, trade association, or governmental agency tracks all of the diverse distribution channels through which tea is sold. Very few reporting entities monitor or analyze the US food-service industry specific to tea activity, despite the fact that — according to the Tea Association of America1 — 85% of US tea consumption is iced tea, a majority of which is sold in food-service settings, including restaurants, cafés, delis, and similar establishments. Additionally, a number of other tea distribution channels are not assessed by any one entity, including mail order, online, network marketing, Whole Foods Market, and thousands of independent specialty tea shops. (Please consult the footnotes at the end of each table for the parameters of SPINS/IRI Channel coverage presented in this report.)
In 1990, annual sales of tea sold through all distribution channels in the United States was less than $1 billion, according to Sage Group. Estimates of the total market size now range from $4 billion to upwards of $15 billion. The fact that tea is such a ubiquitous commodity sold in myriad packaging formats through a wide variety of diverse channels — some of which, such as food service, are not monitored — makes fully accurate and consistent quantification of sales an imperfect science.2
Three primary factors are catalyzing the US demand for tea:
- Health & Wellness Trends: Consumers are seeking affordable, safe ways to enhance their personal wellness and selfcare regimens. Over 3,000 science-based studies have investigated tea-health connections (P. Goggi email to Brian Keating, January 14, 2015).
- Media Coverage: Consistent media coverage delivering a stream of positive news on the research validating benefits of tea consumption — including potential prevention or risk reduction of certain diseases and enhanced states of wellbeing — is helping educate and motivate consumers.
- Evolving Retail Landscape: Thousands of independent and multi-unit tea retail outlets are expanding nationwide, offering greater consumer access to finer-quality specialty teas.
In 2012, global specialty coffee leader Starbucks acquired Teavana, the largest North American retail tea chain. Starbucks paid $620 million for Teavana, which comprised more than 325 shops as well as a vibrant online consumer-direct business. This was the largest acquisition in Starbucks history. In 1999, Starbucks purchased specialty tea maker Tazo, a producer of both black and green tea blends and herbal teas, for $8.1 million (D. Bolton email to Brian Keating, January 20, 2015). Tea now accounts for 10% of Starbucks’ US retail sales, up from 8% in fiscal year 2009. Starbucks Chief Executive Officer Howard Schultz has noted that “tea represents a massive, strategic opportunity for Starbucks around the world … and with the integration of Teavana complete, we are now executing our plan to double our key [tea] business to $2 billion over the next five years.”3
On January 6, 2015, Starbucks announced that the Tazo brand will no longer be sold at Starbucks retail stores and is being replaced by the Teavana brand. Tazo will now be sold in restaurants, big-box outlets such as Walmart, and grocery locations including Whole Foods. Meanwhile, tea-centric multi-unit retail chains such as DAVIDsTEA, Argo, T2 (Unilever), Peet’s, and Coffee Bean & Tea Leaf are attracting young tea drinkers, encouraging innovation in forms such as shaken teas and tea lattes, and also driving supermarket sales. New tea brewing technologies such as the Keurig® single-serve K-Cups® tea pods are placing Bigelow and other major brands in tens of thousands of hotel rooms and stocking the shelves at big-box retailers like Target, Walmart, and Costco.4
Industry veterans anticipate continued major growth for tea. George Jage, founder of the World Tea Expo, predicted in 2014 that there will be nearly “8,000 tea-specific retail outlets in the US by 2018; moreover, an estimated 40,000 traditional coffee retailers will generate more than 30% of their beverage sales from tea.”5
With few exceptions, 2014 was another banner year for the majority of bagged and loose tea categories within all distribution channels. Black tea (bags) held its seemingly permanent number-one spot in dollar sales even with very modest gains (2%) over 2013. Iced teas remained in the second overall position despite a 4% decline from 2013 sales, which could be due to weather or marketing factors occurring during the year.
Catalysts driving the reported consistent annual growth of tea in most formats depend on many factors including very warm summer weather in 2014 and consumers’ increasing disenchantment with carbonated soda. Total sales volume for carbonated soda drinks (CSD) fell 3% in 2013 — the ninth consecutive year of decline according to Beverage Digest6 — after declines of 1.2% in 2012 and 1% in 2011. The publication further predicted in its January 16, 2015, edition that there will be further drops in CSD consumption during 2015.7 All of these developments bode well for growth in other beverage categories, including tea.
Iced tea, as measured by gallons consumed and total sales, is the single largest type of tea consumed in the United States, yet most of this is consumed in food-service establishments, which are not tracked by major consumer product monitoring agencies.
Green and white tea bags continue to hold a respectable third overall position in terms of total dollar sales, with a 4.4% gain in 2014 over 2013. It is important to note that total dollar sales of white tea in the United States remain nominal, with very few brands offering white tea products. Modest annual production — less than 1% of global annual tea production — is estimated by Sage Group in China’s Fujian province, where white tea originated and remains the top-producing region. Between the mid- 2000s and 2011, green tea consumption in the United States increased at a far greater rate — high double digits for many product formats — and has declined, in bagged formats, to more sustainable growth rates. In 2014, green and white teas in loose forms continued their explosive growth of more than 40% over 2013, significantly outperforming their bagged counterparts. Only herbal beverage teas enjoyed even higher 2014 vs. 2013 growth at more than 53% (Table 1).
The jump in loose tea sales is in part due to the increasing willingness of consumers to brew loose tea (which usually costs less than bagged tea) at home and also as a result of the dozens of tea brands more effectively educating consumers on the superior flavors typically associated with loose teas vs. tea bags; such brands essentially are encouraging their customers to trade the convenience of tea bags for better “cup quality” (improved flavor, aroma, color, and mouth-feel). An endless stream of new tea-brewing accessories also is making loose tea preparation an easier exercise for consumers. That green tea bag sales in the United States are approaching half that of black tea bags is remarkable for a nation of tea drinkers who, historically, have favored black tea. The growing body of scientific research increasingly supporting green tea’s health benefits is impressive, and announcements of recent positive findings are picked up by global media with more frequency.
Herbal beverage teas and medicinal teas sold in bags stood strong in fourth and fifth place, respectively, reaching year-over-year gains of 6.6% and 12.3%, respectively. Medicinal loose tea slowed a bit year-over-year (down 2.3%), likely due to more consumers reaching for bagged medicinal teas. Herbal beverage loose format teas had a massive increase in 2014 over 2013, which may be attributed to a combination of factors, including aggressive marketing by various brands.
When it comes to consumption of medicinal teas, Americans still prefer the ease of a teabag over loose tea, while many also consume herbal dietary supplements as documented and analyzed in HerbalGram’s annual Herb Market Report.8 The overall rise in sales for herbal beverage and medicinal teas in a majority of formats during 2014 can be attributed to many factors and is indicative of a growing interest in using readily obtainable botanicals to enhance personal wellness and self-care regimens. The 7.9% growth in total herbal dietary supplement sales in 2013 over 2012, as calculated by SPINS/IRI and reported in HerbalGram, adds further validation to this perspective.
African rooibos (“red tea”; Aspalathus linearis, Fabaceae) — one of the most popular herbal teas worldwide — has enjoyed consistent growth for more than a decade due its lack of caffeine, its naturally occurring antioxidants, and aggressive promotion by South African producers. In 2014, rooibos in bagged format experienced a rare decline in sales, likely due to market saturation and competition from other herbal teas. While herbal beverage and medicinal teas are commonplace in Europe and Asia, Table 1 illustrates that Americans are starting to embrace them more proactively. The fallout over undesirable effects of caffeine in energy drinks, greater awareness of caffeine-insomnia connections, and coffee “burn-out” also may be contributing to the rise in sales of herbal beverage teas as healthy, caffeine-free alternatives.
Chai tea is a traditional Indian tea-based beverage made with black tea and various spices such as ginger (Zingiber officinale, Zingiberaceae), cardamom (Elettaria cardamomum, Zingiberaceae), and cinnamon (Cinnamomum spp., Lauraceae), among others. In 2014, chai teabags experienced considerable advances with a 15.0% increase, likely due to a greater number of brands adding chai to their teabag lines. In this same realm, sales of liquid tea concentrates exhibited a very strong increase — 21.2% — over the previous year. These liquid tea concentrates most often are concentrated chai, tea and lemonade combinations, and other flavorful blends that offer consumers easy preparation without any brewing for iced or hot drinks. Some of the smaller chai companies that started in the 1990s are maturing into sizeable ventures, and this is one reason the category is heating up: most manufacture liquid concentrates, not teabags. A number of companies — including major producers of this tea format such as Tazo — also are promoting liquid tea concentrates as a more economical way to enjoy tea based on the fact that they provide consumers a lower per-serving cost than most ready-to-drink teas.
The Ready-to-Drink Tea Market
Ready-to-drink bottled teas have improved in quality during the past few years, which may be one reason why the category has expanded so impressively in the United States. Additionally, greater numbers of low-/no-sugar and organic RTD tea products have widened consumer choices further within the category. A decline in CSD consumption in the US is helping drive the RTD tea segment as well. Although CSDs are the most widely consumed beverage in the US, CSDs exhibited a year-to-year drop in volume during 2013 — down 1.42% in convenience store outlets (one of the strongest distribution channels for RTD tea) compared to 2012.9
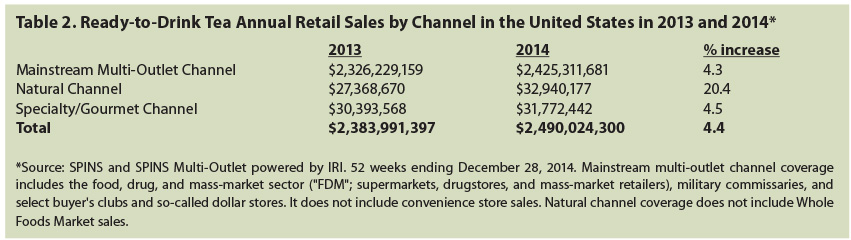
Annual sales in RTD teas in the US increased 4.4% in 2014 over the previous year reaching a total of $2.49 billion (Table 2), with a proliferation of organic, Fair Trade, and non-GMO (genetically modified organism) niches (Table 3). Market research firm Canadean forecast in its Global Iced/RTD Tea Drinks Report that the $5.1 billion US market for RTD tea was expected to increase to $5.3 billion in 2014, with a projected growth rate of 6% through 2018.10 “The refreshing taste and perceived natural, healthy image of iced/RTD tea drinks will continue to generate growth and place the category in a good position to take advantage of the slowing carbonates market,” according to Canadean.10 In spite of the positive performance of RTD tea brands owned by CSD conglomerates such as Pepsi and Coca-Cola, CSD sales in the US have declined nine years in a row through 2013.6 CSD leader Coca-Cola witnessed a 2.2% decline in its 2013 sales,11 while natural brands like Peace, Runa, Bhakti Chai, Guayaki, and others are increasingly capturing consumer engagement. With greater interest in sales of RTD teas, the CSD giants clearly are seeking additional avenues to enter the RTD tea segment with its positive growth outlook. Canadean reports that global sales of energy drinks are in the top spot for fastest-growing beverages followed by RTD teas, water, and coffee.

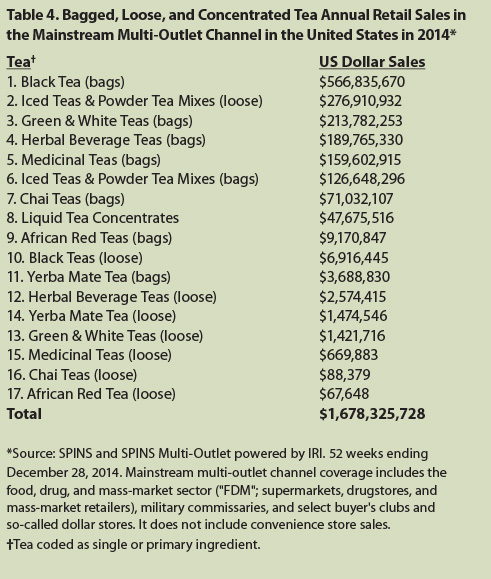
The mainstream multi-outlet — a channel comprising the food, drug, and mass-market sector (or “FDM”; supermarkets, drugstores, and mass-market retailers), military commissaries, select buyer’s clubs, and so-called dollar stores (but not convenience stores or coffee/tea retailers such as Starbucks) — typically stock more conventional tea brands than specialty types, with fewer organic, long-leaf loose, and other types of tea more common to natural food and specialty gourmet outlets. Shoppers at mainstream outlets are purchasing greater varieties of tea types than ever before, but many still visit other retailers to purchase specialty teas. With teabags and loose tea products representing seven of the top-ten items ranked on tea sales, it is clear the mainstream market consumers are seeking convenience (Table 4).
The Natural Channel and Medicinal Teas
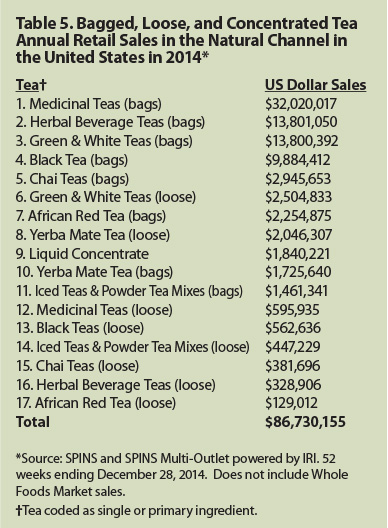
While liquid tea concentrates in the form of ever-popular chai and various iced black and green teas are making headway in natural channel stores, green and white, herbal beverage, and medicinal teas are among the five top-selling tea types (Table 5). This is not surprising as natural channel retailers typically provide a greater breadth of all tea types, especially products with functional appeal. An aging “baby boomer” (Americans born between 1946 and 1964) population seeking little or no caffeine, which is characteristic of herbal and medicinal teas, and more support for their individual wellness programs, likely has helped secure the top sales rankings for the aforementioned teas. A steady flow of media coverage spotlighting the positive outcomes of clinical trials on various teas — especially green — and herbs used in medicinal tea formulations also is contributing to elevated sales, up from lower sales statuses in the mainstream mass-market outlets prior to the mid-2000s.
It is fitting that the total revenue generated by medicinal teas (both bagged and loose) sold through natural channel outlets once again represents more than a third of all tea sales in the channel for 2014 as they did in 2013, according to SPINS (Table 5). Clearly, the natural foods outlet shoppers are serious about wellness, and this is but one indicator of their commitment to selfcare. (These data do not include sales data from natural foods retail giant Whole Foods Market, which does not report its sales activity to SPINS. Whole Foods Market is a major US retail purveyor of tea, and Sage Group estimates the chain has total annual tea sales in all types and packaging formats of more than $125 million.) Natural channel retail outlets have been the pioneering destinations for such teas since the 1960s, and they have continued to promote the benefits of medicinal teas (wellness, functional attributes, etc.) to their customer bases decades later via in-store classes, newsletters, and knowledgeable clerks. Refinements in the flavor and manufacture of medicinal teas, as well as the utilization of standardized botanical extracts and formulation with pharmacopeial-grade herbs, also have boosted this previously minor category to super-star status.
According to SPINS, the six top-selling medicinal tea brands for 2014 include Traditional Medicinals®, Celestial Seasonings®, Yogi Tea®, Organic India®, Bigelow®, and Stash Tea®.
Green and white teas held a strong third-place position in the natural channel for 2014, once again outselling black teas, which perpetually dominate green tea sales in mainstream channels. Natural channel consumers are generally aware of the health-promoting benefits afforded by green tea consumption, and many premium-grade green teas are available in natural channel outlets. Fittingly, in 2014, herbal beverage teas in teabag format hit the number-two spot in the natural channel, in which chai and African rooibos also sell exceptionally well. The cult-like fan-base for South American yerba maté (Ilex paraguariensis, Aquifoliaceae) purchases much of this botanical beverage from natural channel retailers, helping to place both bagged and loose forms among 2014’s top-ten sellers.
In the early 2000s, certified organic teas began to make solid inroads with American consumers, while certified Fair Trade tea was largely still in the germinal stage of project development with certifying agencies. Concerns over GMO ingredients, including tea and even teabag materials, simply were not in the public consciousness. Table 6 demonstrates that, in 2014, these three areas of interest and concern specific to tea have obtained significant market prominence, albeit still a small portion of total tea sales. Certified organic teas continue to make inroads into the overall tea landscape. Medicinal tea brands routinely seek out the purest possible botanicals — herbs, teas, and spices — which commonly equates to the use of certified organic ingredients free from pesticides and other chemical contaminants. Even with herbal beverage and black teas showing strong sales in the organic classification, SPINS-estimated sales for all organic bagged, loose, and liquid tea concentrates topped $214 million for 2014, nearly 12% of the year’s total US tea sales.
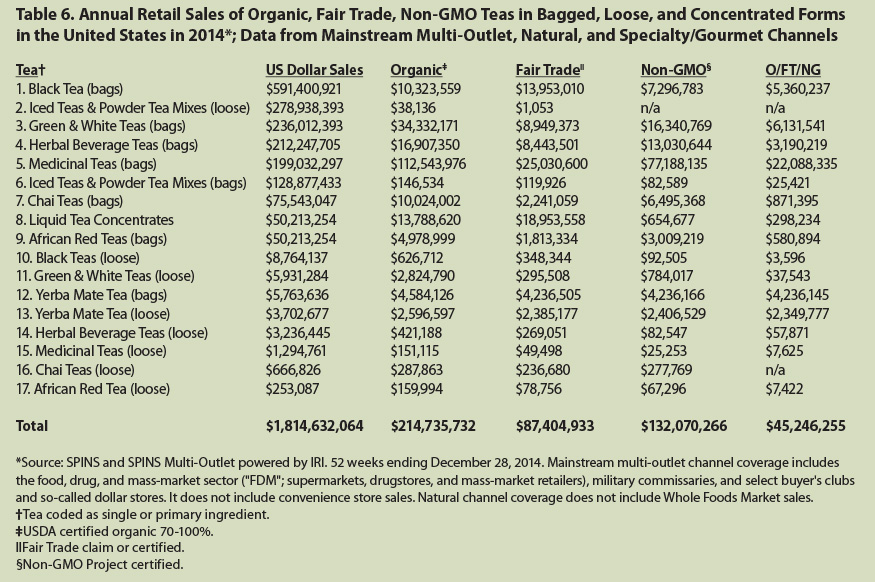
Total sales of certified Fair Trade teas as calculated by SPINS for 2014 were $87.4 million, with medicinal teas (bags) once again in the number-one spot at $25 million, and liquid tea concentrates taking second, bringing in $18.9 million.
Non-GMO teas pulled in sales of $132.1 million during 2014, according to SPINS. It is important to note that the authors were not able to locate any tea agency, association, or producer that is currently aware of teas (C. sinensis) being grown with GMO technology. With consumer awareness and concerns about GMOs, some tea brands are nonetheless seeking Non-GMO Project verification to perhaps allay potential fears or questions by consumers.
It is worth noting that some plant ingredients used in medicinal and herbal beverage teas can be obtained from GMO-sources, such as cornsilk (Zea mays, Poaceae) style and stigma12 as well as eucalyptus (Eucalyptus globulus, Myrtaceae)13 and papaya (Carica papaya, Caricaceae) leaves.12 In teas formulated with excipients, colorants, extracts, flavors, and/or nutrients, GMO elements may be incorporated as well (J. Brinckmann email to A. Lindstrom, November 6, 2014). Extracts and flavors sometimes utilize corn- and soy-based components that are not legally required to be declared on labeling; dry “natural flavors,” for example, frequently are produced by combining corn- and/or soy-based excipients with essential oils. According to the Non-GMO Project, 88% of the American corn crop and 94% of the soy crop are genetically modified.14
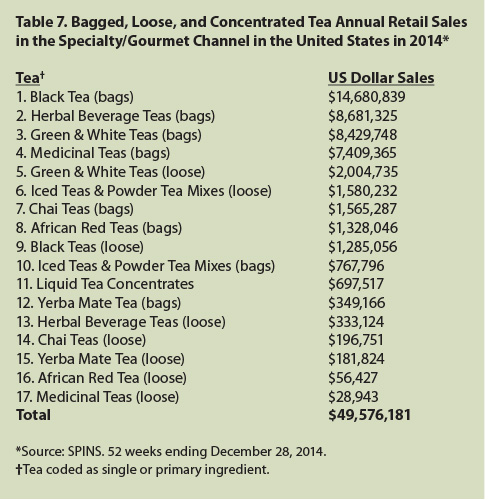
The specialty/gourmet channel (i.e., full-format supermarkets with more than $2 million in annual sales and with specialty items comprising at least 25% of overall volume, as well as high-end, experiential stores featuring full-service gourmet departments and high-quality products with a strong focus on specialty, imported, natural, and organic items), like the natural foods channel, consistently has supported specialty tea business development, and it is a prime avenue for new tea brands to garner sales experience before making the jump to mainstream market shelves. In this channel, bagged teas (vs. loose or liquids forms) lead the pack — as they do in all channels — with their ease-of-preparation and convenience. Black tea sales totaling $14.7 million for 2014 in this channel showcase its immense popularity among specialty/gourmet consumers as indicated by a nearly two-to-one lead in sales over the next closest category, herbal beverage teas (bags), at $8.7 million in sales.
While specialty/gourmet consumers frequent these outlets seeking out exotic foods, flavors, and ingredients, it should be noted that even in this channel, interest in and purchases of medicinal tea is high. Total sales of $7.4 million in 2014 indicate that this is a small percentage of annual medicinal tea sales in the US; nonetheless, that medicinal teabags hold the fourth position of 17 monitored formats and teas illuminates the growing interest in medicinal teas.
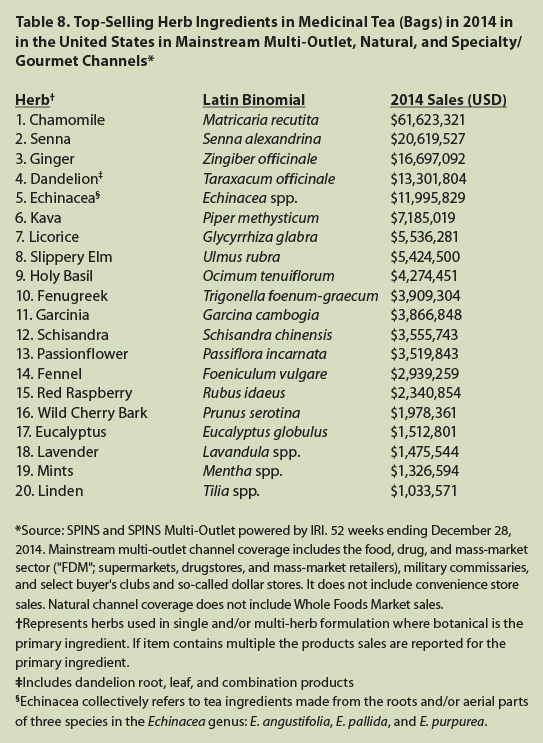
As in the herbal dietary supplements sector, 2014’s top-selling herb ingredients in medicinal tea bags comprise those with structure-function claims such as immune and/or digestive support, stress regulation, and weight-loss promotion.
Chamomile, kava, and lavender are known for their anxiolytic effects, and passionflower has been administered to treat insomnia. Schisandra is an adaptogenic herb with claimed stress-protective properties.
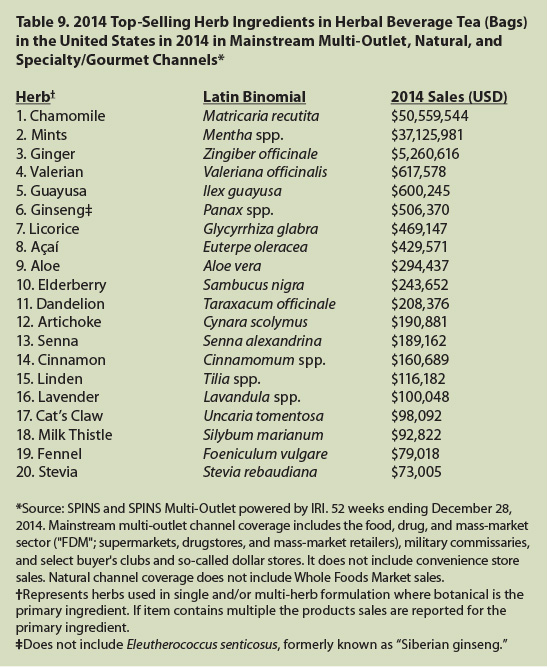
Senna is reliably popular as a natural laxative, and therefore used in products meant to treat constipation or promote weight loss. Ginger and various mints are used in digestive-support formulations, and fennel to treat flatulence. In 2014, fennel — which appeared among the top-20 selling herbs in the medicinal tea category for both 2013 and 2014 (Table 8) — made its way into the herbal beverage top 20 as well, ranked at 19 (Table 9).
The presence of Garcinia cambogia illustrates the ongoing power of “The Dr. Oz Effect”; the cardiologist and talk-show host Mehmet Oz, MD, recently came under fire at a Senate hearing for his promotion of this purported weight-loss aid (among others) due to the alleged lack of scientific support. Despite the negative press, garcinia sales soared in 2014, increasing by about $1 million and placing it at 11th in the medicinal tea category (Table 8).
Echinacea tea is part of many Americans’ cold and flu prevention and/or treatment regimens; licorice and slippery elm — due to their mucilaginous properties — are present in many formulations intended to soothe symptoms such as sore throat and cough, as is wild cherry bark. Eucalyptus, a major ingredient in many cough drops, often is utilized to relieve sinus and respiratory symptoms associated with colds and flu. Red raspberry leaf is a component of many pregnancy-support tea formulations.
Dandelion, the root of which is touted for its liver tonic and digestive-aid properties, had a banner sales year as both a medicinal and herbal beverage tea ingredient. An increase of approximately $3.5 million in sales in the medicinal category resulted in a number-four ranking above 2013’s number four, echinacea. In the herbal beverage tea sector, dandelion debuted in 2014 at number-11 ranking; its 2013 sales did not break the top 20 (Table 9).
Tea Packaging
Folding carton “tea boxes” manufactured from boxboard remain the primary unit packaging for tea products for bagged and loose teas. Production of tea boxes is cost-effective for tea brands and, increasingly, such cartons are made from recycled or recyclable materials (and commonly printed with soy-based inks). During 2014, canister growth slowed considerably with roughly a half percentage point increase over 2013; a number of tea brands simply opted for the more cost-efficient folding carton tea boxes. While some smaller and mid-size tea brands utilize round canisters to merchandise their teas, this type of packaging has its limitations — they are not always recyclable, they make less-efficient use of precious shelf space on already-crowded retail shelves, and they are considerably more expensive than cartons.
Liquid pouches containing single-serving portions of various herbal teas enjoyed a stellar 2014, though the category is still relatively small at just over $6 million in sales (Table 10). Sales of canned teas also rose significantly during this time period as more brands started using the format to contain their teas, herbs, and yerba maté liquids.
Veteran tea industry analyst Dan Bolton (personal communication to Brian Keating, January 30, 2015) says tea in single-serve pod format automatic brew capsules has experienced remarkable growth in the past two years. According to Bolton, every major tea brand has entered this market segment. Furthermore, he points out that US household penetration of automatic coffee pod brewers is approaching 15 million units and may ultimately surpass 40% of all homes, exposing millions of coffee drinkers to quality tea conveniently prepared. Pods (or “cups”) rose a surprising 11% in 2014.
Conclusion
The US tea industry, like much of the global tea space, is undergoing a major transformation of unimagined implications. Within the US and Canada, sales are rising for almost every type of tea and herbal tea, packaging format, and distribution channel. Media reports on “all things tea” are exceptionally positive and reaching consumers on a daily basis. Restaurants of all types are serving numerous options from fine tea service to exotic iced teas. A decade ago, a few die-hard tea aficionados brewed their teas mostly at home — now it is commonplace to brew specialty tea at home and in the workplace. That the world’s largest tea company — Lipton (Unilever) — invested $40 million in a campaign to promote the brand globally with Muppet mascots and Oscar-night ads is but another sign that the time for tea to take center stage has arrived. Tea is seeping and steeping across the great American beverage landscape in innumerable ways.
While some consumers simply see tea as a non-caloric alternative to coffee and even energy drinks, many more are choosing tea as their daily drink-of-choice for specific health-promoting properties. This Tea Market Report demonstrates that sales of medicinal and herbal teas are exceptionally strong and rising. With an uncanny similarity, the hundreds of new tea retail outlets — and thousands more projected to open in the next few years — parallels the germinal stages of the fledgling US natural foods industry circa 1980-2000. Independent and smaller chains of tea shops are morphing into well-organized, multi-unit chains, and these tea-centric cafés, salons, and bars are raising awareness for tea. This phenomenon occurred with the “mom-and-pop” natural food stores for years, ultimately resulting in powerhouse retailers such as Whole Foods Market and others promoting the healthier-food agendas. A similar path is advancing rapidly with tea-focused retailing.
Tea is satisfying the thirst and wellness needs of diverse consumer populations seeking economical, easy beverage choices to support health and nurture wellbeing.
References
- Tea fact sheet. Tea Association of the USA, Inc. website. Available at: www.teausa.com/14655/tea-fact-sheet. Accessed November 3, 2014
- Tea and Ready-to-Drink Tea in the U.S.: Retail and Foodservice, 5th ed. Packaged Facts website. Available at: www.packagedfacts.com/Tea-Ready-Drink-8090955/. Accessed November 3, 2014.
- O’Connor C. Starbucks opens its first tea bar as CEO Schultz bets on $90 billion market. October 23, 2013. Forbes. Available at: www.forbes.com/sites/clareoconnor/2013/10/23/starbucks-opens-its-first-tea-bar-as-ceo-schultz-bets-on-90-billion-market/. Accessed November 3, 2014.
- Bolton D. Teavana trumps Tazo at Starbucks. World Tea News. Available at: www.worldteanews.com/news/teavana-trumps-tazo-starbucks. Accessed February 9, 2015.
- Jage G. The greatest tea retail expansion has begun. World Tea News website. Available at: www.worldteanews.com/insights/greatest-tea-retail-expansion-era-begun. Accessed November 6, 2014.
- Special issue: US beverage results for 2013. Beverage Digest. Available at: www.beverage-digest.com/pdf/top-10_2014.pdf. Accessed November 3, 2014.
- 2014 and 2015: CSD volume decline is forecast to worsen. energy drinks to accelerate. Beverage Digest. Available at: www.beverage-digest.com/editorial/archive15.php#150116. Accessed February 9, 2015.
- Lindstrom A, Ooyen C, Lynch ME, Blumenthal M, Kawa K. Sales of herbal dietary supplements increase by 7.9% in 2013, marking a decade of rising sales. HerbalGram. 2014;103:52-56.
- RTD tea: the ultimate victor. World Tea News website. Available at: www.worldteanews.com/news/rtd-tea-ultimate-victor. Accessed November 3, 2014.
- Global Iced/RTD Tea Drinks Report. PR Newswire. Available at: www.prnewswire.com/news-releases/global-icedrtd-tea-drinks-report-2013-234062051.html. Accessed November 3, 2014.
- Coca-cola earnings review: volatile emerging economies limit top line growth. Trefis website. Available at: www.trefis.com/articles/category/by-company/ko. Accessed November 3, 2014.
- What is GMO? Agricultural crops that have a risk of being GMO. Non-GMO Project website. Available at: www.nongmoproject.org/learn-more/what-is-gmo/. Accessed November 6, 2014
- Eucalyptus. GMO Compass website. Available at: www.gmo-compass.org/eng/database/plants/34.eucalyptus.html. Accessed November 6, 2014.
- Nature vs. ‘Nurture’: The Splicing and Dicing of Our Food Supply. SPINS Trendwatch. Schaumberg, Illinois: SPINSscan Natural. 2014: 1-2.
|