Issue:
95
Page: 60-64
Herb Supplement Sales Increase 4.5% in 2011
by Mark Blumenthal, Ashley Lindstrom, Carla Ooyen, Mary Ellen Lynch
HerbalGram.
2012; American Botanical Council
By Mark Blumenthal1, Ashley Lindstrom1, Carla Ooyen2, and Mary Ellen Lynch3
1 American Botanical Council, Austin, Texas, USA
2 Nutrition Business Journal, New Hope Natural Media, Boulder, Colorado, USA
3 SPINS, Schaumburg, Illinois, USA
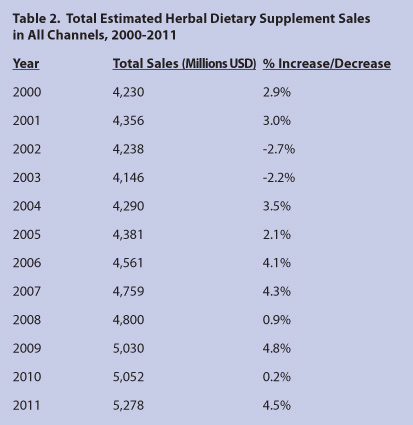
Sales of herb and botanical dietary supplements in the United States increased an estimated total of 4.5% in 2011 according to aggregated market statistics calculated by Nutrition Business Journal (Table 1), despite still relatively weak economic conditions in the United States and worldwide. This total sales growth is greater than the increase in sales noted in the previous Herb Market Report for the year 20101 — the initially stated increase being pegged at 3.3%, then later revised downward to a mere 0.2%, due to sales data that was obtained and evaluated after press time for the 2010 report. (This was due primarily to poorer-than-expected performance in the direct-to-consumer channels — data that became available after publication date.2) The 2011 increase marks the 8th year in a row since 2004 in which herb sales increased over the previous year (Table 2).
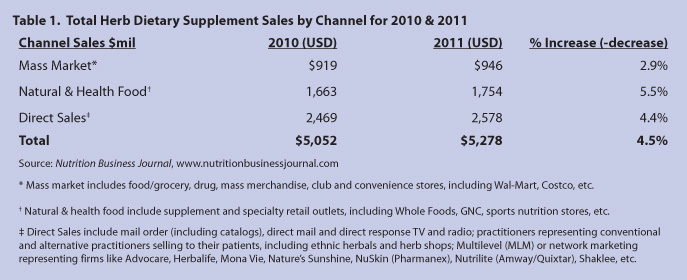  As has been the case in previous years, total herb supplement sales in the different market channels varied, according to statistics provided by market research firms, from a strong 6.9% in the mainstream market (Food, Drug, and Mass Market retail stores, FDM), to an even stronger 9.0% in the natural channel.
Mainstream Channel – Food, Drug, and Mass Market (FDM)
In the FDM channel for 2011, a total sales level of $379,286,600 was calculated by the Chicago-based research firm SymphonyIRI — an increase of $23,361,300 over sales of $355,925,300 in 2010 — reflecting a significant increase of 6.9% (Table 3). In general, the FDM channel represents mainstream acceptance and success of numerous popular herbs, e.g., bilberry fruit extract, black cohosh root, garlic, ginger root, ginkgo leaf extract, Asian ginseng root (with some American ginseng sales probably mixed into the statistics as merely “ginseng”), milk thistle fruit extract, saw palmetto berry, St. John’s wort herb extract, and others. Sales statistics for SymphonyIRI, as shown in Table 3, are based on sales from chain drug and food stores, and other mass-market retailers, but do not include herb supplement sales in Wal-Mart, warehouse buying clubs (e.g., Costco, Sam’s), or convenience stores (e.g., 7-Eleven). As such, the FDM channel sales in Table 3 reflect a significant, but not total portion of this channel; possibly in the range of up to 50%, but this is merely an educated guesstimate. Insofar as Wal-Mart is considered the largest retail outlet for dietary supplement sales in the US, the sales percentage in Wal-Mart is a considerable, but unreported, portion of total FDM sales. 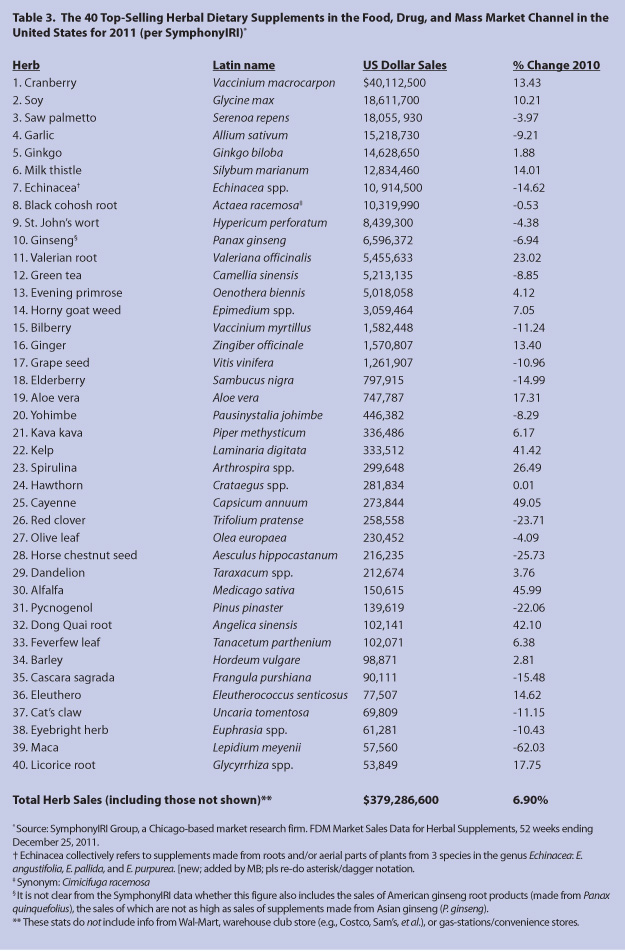
The increase in last year’s FDM sales was pushed by strong, double-digit increases in the following top-20 herbs, according to SymphonyIRI: cranberry (+13.43%), soy (+10.21%), milk thistle seed (+14.01%), valerian root (+23.02%), ginger (+13.40%), and aloe vera gel preparations (+17.31%). Herbs showing strong increases in the top 21-40 rankings (the first time HerbalGram has reported these “second-tier” rankings, per Table 3) include kelp (+41.42%), cayenne pepper (+49.05%), alfalfa (+45.99%), dong quai root (+42.10%), eleuthero root (+14.62%), and licorice root (+17.75%).
Sales increases were not uniform across the board, with some herbs experiencing significant declines in the FDM market, according to the SymphonyIRI statistics. These include maca root (-62.03%), echinacea aerial parts and/or root (-14.62%), elderberry (-14.99%), and horse chestnut seed extract (-25.73%).
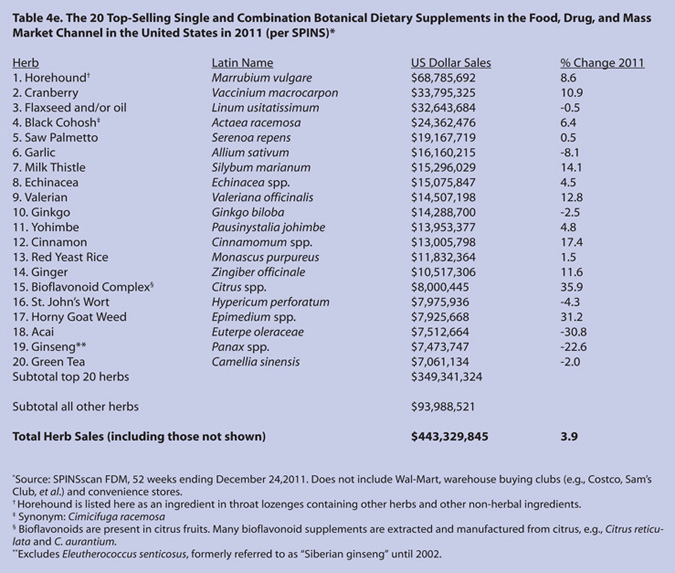
Compared to the SymphonyIRI data, SPINS provides a slightly different ranking of total supplement sales in the FDM channel, based largely on data supplied by Nielsen (Table 4e [online only]), with a calculated total growth rate of 3.9% on sales of $443,329,845.
As an example of the complexity of any analysis of this segment, NBJ’s analysis for the total sales of herbal DS in the total mainstream/FDM channel (including estimated sales in buyers’ clubs and convenience stores, including Wal-Mart, Sam’s Club, Costco, et al.) shows that herbal DS sales grew at a lower rate than those reported by either IRI or SPINS/Nielsen — i.e., an NBJ-calculated increase estimating growth at 2.9% in 2011, down slightly from NBJ’s estimate of 4.0% in 2010.
As was noted in last year’s publication of this annual report, many of the most popular herbs sold in the FDM market are either conventional foods and/or common spices. These include (in order of their rankings) cranberry, soy, garlic, green tea, bilberry, ginger, kelp, cayenne pepper, and barley. Other “edible” or food-oriented herbs include grape seed, elderberry, kelp, spirulina, and maca root.
Also, as expressed in last year’s report, the top-ranking sales of single herbal DS in both the FDM and natural channels represents a long-noted trend of consumer interest in many of the more well-researched herbs that have become relatively familiar due to a growing body of scientific and clinical research conducted on them. These include the following, as noted in order of ranking for sales in the FDM channel (Table 3): cranberry, saw palmetto, garlic, ginkgo, echinacea, milk thistle, black cohosh, Asian ginseng, green tea, etc.
A dynamic that was discussed in the report of the 2010 market is the actual determination of herbs that constitute the top 20 in sales as compiled by SymphonyIRI (top-40 herbs in this report, Table 3) and the top 20 in Table 4e as determined by SPINS FDM powered by Nielsen. While it is understandable and predictable that the rankings and inclusion of herbs would vary in the natural channel compared to the FDM channel (as noted below), it is noteworthy to see horehound (Marrubium vulgare, Lamiaceae) as the top-selling herb in the SPINS FDM rankings (which include singles, herbal combinations, food supplements, and miscellaneous supplements) — reportedly generating $68,785,692 in sales in 2011! This again raises the question as to whether ABC should be stating that horehound is one of the top-selling herbs in the United States, a statement that would probably be met with considerable curiosity, if not skepticism, by many market veterans.
As we stated last year, horehound has never been listed as a top-selling herbal supplement in any previous HerbalGram Herb Market Report in either the FDM channel (as measured by SymphonyIRI) or the natural channel. Digging deeper, SPINS revealed that this herb is the primary ingredient in several Ricola® (Ricola AG; Laufen, Switzerland) cough or throat drops, which are included in its natural channel coding. According to 2008, 2009, and 2010 SPINS FDM powered by Nielsen data, within their data-collection parameters, horehound sales — which include the Ricola products for which SPINS assigned horehound as a primary ingredient, and other dietary supplement products for which SPINS identified horehound as the main (or only) ingredient — have been significant and showing a trend of growth, bringing in a total of $58.7 million in 2008, $64.7 million in 2009, $63.3 million in 2010, and $68.8 million in 2011.
Horehound is a well-known traditional folk remedy for sore throats, but there has been little modern research on this herb and ABC is unaware of any published clinical trials supporting its efficacy for cough or for soothing a sore throat. A few studies have suggested efficacy of horehound-containing herb combinations in humans and horses, but studies on horehound alone are lacking.
Natural Channel
In the natural channel, total calculated sales for herbal supplements in 2011, according to SPINS, were $251,212,449, representing a whopping 9.0% growth over 2010 sales (Table 5). (SPINS calculated a negative growth of -0.6% in 2010. Nearly one-third of the decline seen between 2009-2010 in the natural channel was due to the decline of açaí fruit-based DS in this market channel.)
 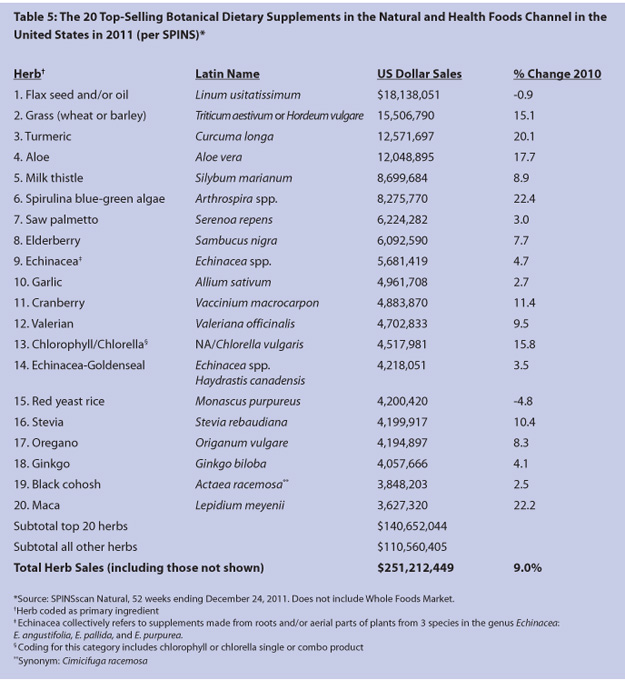  At present, it is not precisely clear what accounts for the increase in this channel, usually characterized by what some market experts refer to as “core shoppers” — those with a relatively strong commitment to a natural lifestyle, natural foods, and natural health modalities (compared to the “peripheral shoppers” who purchase the majority of their dietary supplements in the FDM channel). However, key herbal supplements show evidence of significant growth: sales of the increasingly popular turmeric root (and its concentrated extract) grew 20.1%, while various types of greens also showed remarkable growth: wheat and/or barley grass - 15.1%; spirulina blue-green algae - 22.4% (SPINS codes spirulina single supplements and blue-green algae single supplements in the same category; combinations of the two may also be represented); and aloe vera - 17.7% (together, these 4 herbs account for nearly one-third of sales gains in this channel); and chlorophyll and chlorella algae - 15.8%. Also showing significant sales in 2011 in the natural channel is maca, with a strong 22.2% increase from 2010, a curious anomaly compared to its significant drop (-62.03%) in sales in the FDM channel during the same year.
Resveratrol, which appeared among 2010’s 20 top-selling herbs in the natural channel, was ranked 21 in 2011, possibly due to questions of its bioavailability and interest in a resveratrol analogue called pterostilbene, according to Kerry Watson, manager of SPINS’ product library.
Sales compiled by SPINS for the natural channel do not include herb supplement sales from Whole Foods Market, the largest chain of natural food groceries in the United States. Accordingly, as is the case with the lack of sales reports from Wal-Mart in the aggregate for the FDM channel, these statistics for the natural channel represent a significant, but not total aggregate of herb supplement sales in natural food stores. NBJ has estimated 5.4% growth for the total natural channel in 2011, with its estimates attempting to include sales at those natural retailers (e.g., Whole Foods) not included by SPINS. Some estimates suggest that sales of herbal DS from Whole Foods might constitute as much as 50% of the entire natural channel’s sales, but such estimates are not confirmed. If such estimates are valid, sales for the total natural channel would be about 100% higher than those reported by SPINS in Table 5.
Direct Sales
Sales of herbal dietary supplements in the so-called direct sales channel include multi-level marketing companies (aka network marketing companies, e.g., Advocare, Herbalife, MonaVie, Morinda Bioactives, Nature’s Sunshine, Amway’s Nutrilite, Pharmanex/NuSkin, Shaklee, and others), mail order and Internet sales companies (e.g., i-herb, Indiana Botanic Gardens, Swanson’s, et al.), and healthcare practitioners. As shown in Table 1, further attesting to the overall robustness of the herbal supplement market in the past year, this segment experienced healthy growth of an estimated 4.4%, reflecting estimated sales from $2,469,000 in 2010 to $2,578,000 in 2011.
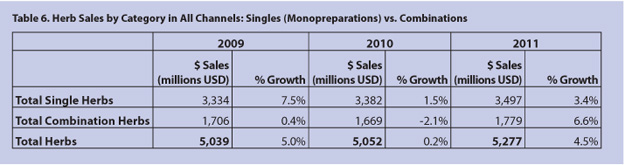
As shown in Table 6, estimates for sales of single herbal DS in all channels of trade increased by 3.4% in 2011 over 2010, according to NBJ. This compares to a smaller growth rate of 1.5% in 2010 over 2009. Sales of combination formulations (usually marketed for a specific function or benefit, e.g., maintaining normal cholesterol levels, normal blood sugar levels, urinary tract or prostate health, etc.) increased 6.6% in 2011 compared to 2010, the first significant increase in sales of combinations since 2007.
Finally, it bears emphasis that sales discussed in this article pertain only to those involving herbal dietary supplements, and do not include herbs sold as teas, beverages, or as ingredients in natural cosmetic products, including the so-called “cosmeceutical” products. The data for the mainstream market from SymphonyIRI is based on single-herb DS, while the SPINS data for the natural channel include sales for herbal singles, herb combinations, herbal food supplements, and other miscellaneous supplements. The SPINS natural channel data exclude conventional food and beverage (e.g., herbal teas, ready-to-drink teas, and other herb-containing beverages, etc.), body care and cosmetics, and herbs sold in the general merchandise categories. Additionally, aggregate market channel totals compiled by NBJ also include single and combination herbal DS but none of the other non-DS categories just mentioned.
References
- Blumenthal M, Lindstrom A, Lynch ME, Rea P. Herb Sales Continue Growth – Up 3.3% in 2010. HerbalGram 2011;90: 64-67.
- Lindstrom A. Estimated Herb-Sales Growth in 2010: Clarification. HerbalGram. 2011;92:65.
|